
A good runbook is the calm colleague who is awake when you are not. A six-part template, writing tips, and a full example for a core uplink.
Continue reading Runbooks an on-call engineer can use at 3 a.m. ›
Counters, five-minute graphs and red dots: how SNMP, MRTG, RRDtool, Nagios, Cacti, Zabbix, LibreNMS and Prometheus shaped the monitors we run today.
Continue reading From MRTG to Prometheus: a short history of open-source network management ›
A five-VLAN plan for a house: what goes where, which switch ports carry tags, the firewall rules between networks and how to keep casting working.
Continue reading VLANs at home: separating IoT, guests and servers ›

Four stages, the skills that move you between them, and the certifications that help. A plain plan for getting from the phone queue to the wiring closet.
Continue reading From help desk to network engineer: a realistic path ›
99.9 percent of a 30-day month is 43.2 minutes. The window, the maintenance clause and the place you measure from decide the rest.
Continue reading What 99.9 percent really allows: uptime maths and how SLAs are measured ›
One rsyslog server, one folder per device, logs you can grep at 2 a.m. Formats, severities, device settings, rotation and clocks for a small network.
Continue reading Syslog for small networks: collect, rotate and actually read your logs ›
What ifHCInOctets, ifInErrors and ifOutDiscards really count, how a rate is computed, and the worked math behind a graph that lies after a wrap.
Continue reading Interface counters explained: octets, errors, discards and the 32-bit wrap ›
Four open-source monitors, four ideas of what a measurement is. How Nagios, Zabbix, LibreNMS and Prometheus store data, where each hurts, and who each suits.
Continue reading Nagios, Zabbix, LibreNMS, Prometheus: choosing an open-source monitor ›

A page should mean someone has to act now. Symptom alerts, severity tiers, hysteresis, dependencies and three bad alerts rewritten.
Continue reading Alert fatigue: writing alerts people still read six months later ›
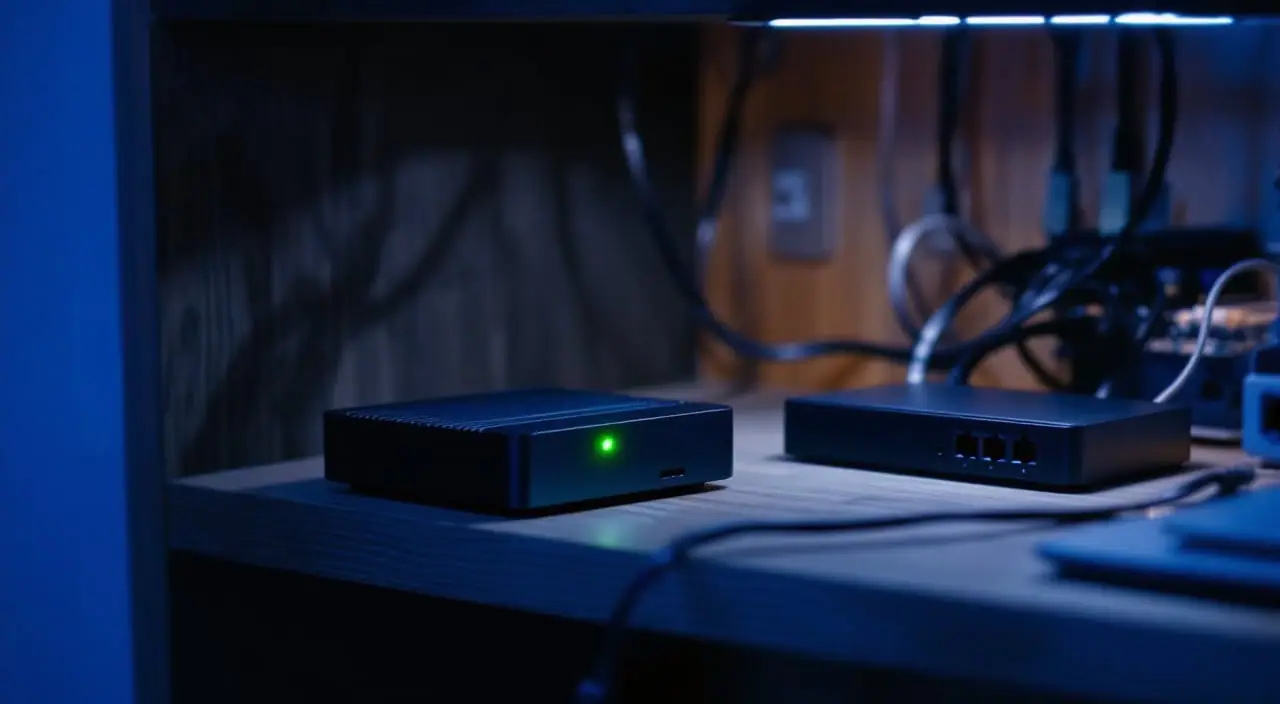
A Raspberry Pi, a USB SSD and two days: the home-lab monitoring box I would build again, from SNMP on the router to power and cooling.
Continue reading Monitoring a home lab from a Raspberry Pi: a weekend build ›

Five minutes is a habit from the MRTG years. How to pick intervals per metric, with counter wrap math, burst examples and storage costs.
Continue reading How often should you poll? Choosing a polling interval ›

Community strings, USM users, GETBULK and 64-bit counters: what each SNMP version changed, and when v2c is still a fair choice.
Continue reading SNMP v1, v2c and v3: what changed and which one to run ›